


In my day job I run a small high-frequency trading firm. We focus on crypto and run trading strategies across most major crypto exchanges and platforms (e.g. Binance, OKX, Uniswap, etc.). One of the trickiest parts of the job is figuring out which platforms to invest incremental time into understanding and integrating into our trading process.
This is particularly challenging because crypto is a highly narrative driven industry full of hype, unsustainable incentives, and occasional outright scams. It is easy to lose time and money chasing flavor-of-the-month trade ideas on new platforms. At the same time, it pays to be early to a new trend — you can develop a moat around trades and build advantages that are hard for newcomers to overcome. All of my early success as an algorithmic trader in crypto came from being quick to integrate new exchanges and protocols when they launched. Almost every one of those products no longer exists today, but they were fun and profitable while they lasted.
These days, my trading firm focuses on the parts of crypto that we expect to endure and add value. Although we sparingly integrate new exchanges, last year we made a big bet on Hyperliquid. At the time, Hyperliquid was a small decentralized derivatives exchange with negligible volume, but it was cleverly architected, well-documented, and showed promise.
Since then, the project has exceeded our expectations. We typically trade on centralized exchanges (CEXs), prioritizing fast execution and clean, simple interfaces. Despite running on a blockchain, the experience of using Hyperliquid is almost indistinguishable from a CEX.
While our experience as API traders has been excellent, it is clear that the average retail user of the platform is having a similarly seamless trading experience. This has likely contributed to our own success on the platform: a wide diversity of retail users brings non-toxic and uncorrelated flow, which in turn creates a healthy ecosystem for trading firms like ours to prosper.
As Hyperliquid approaches the launch of their token, we’ve decided to open-source some of our proprietary research that we’ve used to validate our continued investment in the Hyperliquid ecosystem. Usage metrics demonstrate that Hyperliquid is a sticky application and has the potential to grow into a viral app that can challenge the dominant centralized exchanges of crypto.
For the following analysis, we split users into three cohorts:
Whales (6.2% of users) have done $50m+ in volume or have $1m+ in account equity.
Semi-pros (53% of users) have done between $2m and $50m in volume or have $100k+ in account equity.
Retail (40.8% of users) have done between $500 and $2m in volume.
Users that fall in multiple cohorts are promoted to their highest tier.
Retention Rates
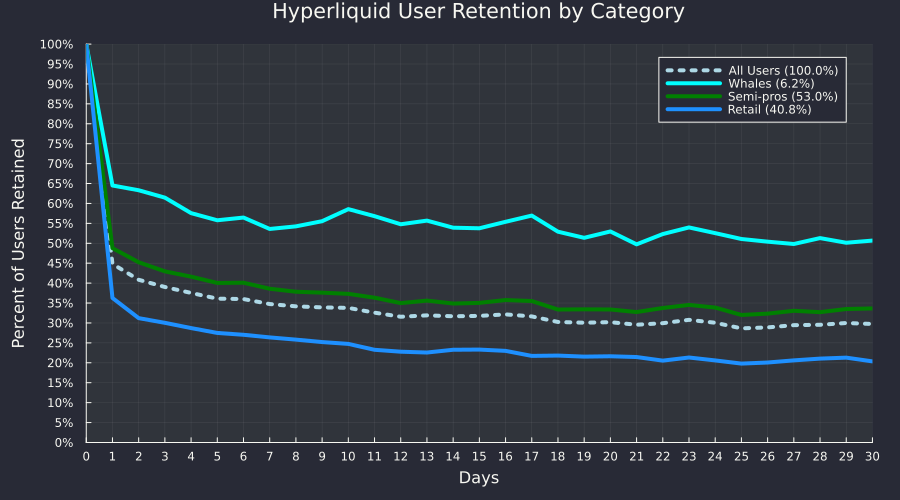
The 30-day retention for all users is ~30%, with whale retention at ~51% and semi-pro retention at ~34%. For the smallest volume retail user, retention is still above 20%, which is impressive when compared to a typical crypto trading or brokerage app. The numbers below from the white hot bull market of 2021 show that even the least engaged users on Hyperliquid are more engaged than the average user of popular trading apps in 2021 over the course of a 30-day period.

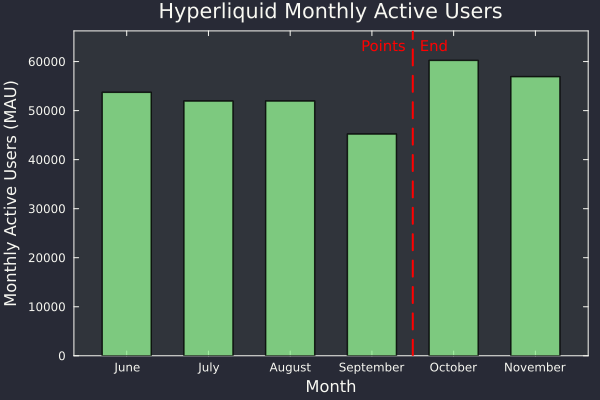
Moreover, this activity isn’t just a function of points and incentives. The data is a bit noisy since points only ended on October 1st, but if anything we see that retention metrics are better since then. In fact, we see a bit of a “smile” retention curve after points end — often considered a good sign for a utility application. We also see an uptick in monthly active users (MAUs) since the end of points.

Engagement
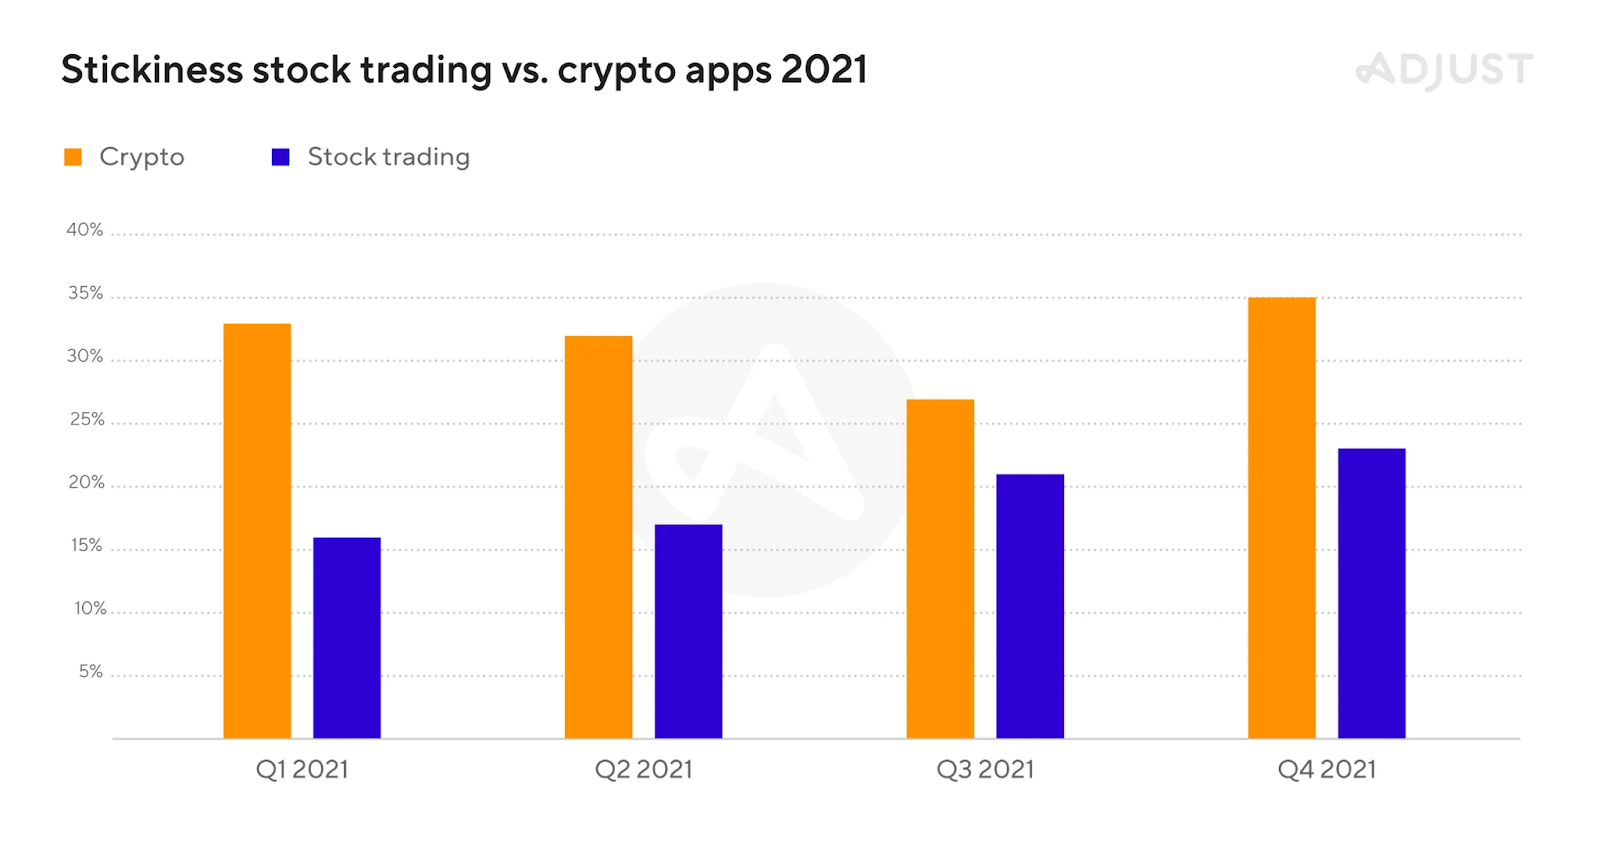
Another common metric used to measure engagement is the ratio of Daily Active Users (DAUs) to Monthly Active Users (MAUs). This is sometimes referred to as the “stickiness” ratio of an app.

This a16z post details what good engagement metrics look like for social apps. According to the post, a social app is great if it has 50%+ engagement, good if it has 40%, and OK if it has 25% engagement.
Keeping in mind that social apps typically receive a lot more engagement than utility applications like Hyperliquid, these numbers look very good. Among the power users, engagement looks great and for casual retail users, they are solid. When comparing these results to the most used apps from the bull market of 2021, we see that Hyperliquid is performing similarly well.
Interpretation
In addition to the stats we’ve detailed here, more general stats about the Hyperliquid exchange are available at https://stats.hyperliquid.xyz/. Taken in concert, we see that:
Liquidity is comparable to tier 1 and tier 2 centralized exchanges and is improving.
Open Interest continues to grow considerably alongside daily volume.
User growth is reasonable, though Hyperliquid doesn’t seem to have yet made an impact outside of the most engaged crypto participants.
When users try out Hyperliquid, they tend to stick around and continue trading. Over time this brings organic flow to the exchange, even if they originally came solely for the airdrop incentives.
These are exactly the signs we like to see on a platform that we are betting on. It gives us the confidence to double down on building and trading within the Hyperliquid ecosystem.
Appendix A: Notes on Methodology
This analysis uses publicly available Hyperliquid block data collected between 1 June 2024 and 22 November 2024. Each individual master account address is treated as a separate user. Although for most blockchains treating individual addresses as users leads to incorrect analysis, we have stronger reason to believe that individual addresses do largely represent individual users, especially for whale and semi-pro users (though it’s certainly not a perfect one-to-one mapping). The reasons are:
It is widely understood that the HYPE airdrop will be linear with points tally. From the early days of the project, this was the general expectation amongst points holders. The linear airdrop of the PURR memecoin to points holders in April confirmed this expectation. This provides a strong disincentive to Sybil attack the protocol.
Fees are a function of master account volume, so for higher volume users it costs more to split up activity over multiple accounts instead of concentrating volume on a single account.
The metrics don’t significantly change after the end of the points period.
Furthermore, the engagement metrics are almost certainly an underestimate of the true stickiness of Hyperliquid. It does not count days where users visited the app to check their portfolio but did not place a trade.
Appendix B: Follow-ups
Another important metric for understanding engagement is average session duration — this cannot be directly inferred by using transaction information from public block data, but perhaps a proxy metric that uses public transactions would be similarly useful.
It is likely too early in the product’s evolution to estimate customer lifetime value, but because Hyperliquid (and presumably eventually the HYPE token) earns revenue from fees, it is pretty straightforward to estimate the value generated from different customer segments.
Thanks to Rajiv Patel-O’Connor (@rajivpoc) for help with the user cohort analysis, code review, and for reviewing this post.