
Hyperliquid Is Still Sticky After All These Years
Its unique stickiness is not about points, an airdrop, or the bull market. It’s just a good app.

Every perp DEX that adopted crypto’s standard points-and-airdrop playbook has now run the same experiment: use incentives to drive volume, then turn them off and hope the users are sticky. Lighter, Aster, edgeX, and Paradex each lost 60–95% of their volume as rewards wound down. Hyperliquid followed a different trajectory. Since ending its points program and announcing its airdrop in November 2024, it has grown to ~8x the daily active traders, ~3x the open interest, and ~6x the monthly volume it had while points were still live.
Why was Hyperliquid able to buck a trend that has plagued crypto apps since before perp DEXs even existed as a category? Two days before the HYPE airdrop, I shared some of our firm’s internal research that pointed to an answer: Hyperliquid was unusually sticky. Its retention rates were strong by consumer-app standards — let alone for a financial app or crypto exchange.
We shared those findings because they revealed stickiness rarely seen in crypto and gave our trading firm the confidence to invest heavily in Hyperliquid infrastructure.
The original post came with two caveats: (1) we had only six months of data and (2) the points program had just concluded. Both caveats are now resolved: we have much more data and the incentives are long gone. So now seems like a good time to revisit the analysis — this time with 770 consecutive days of public block data, 588 of them after the incentives ended.
A different weight class
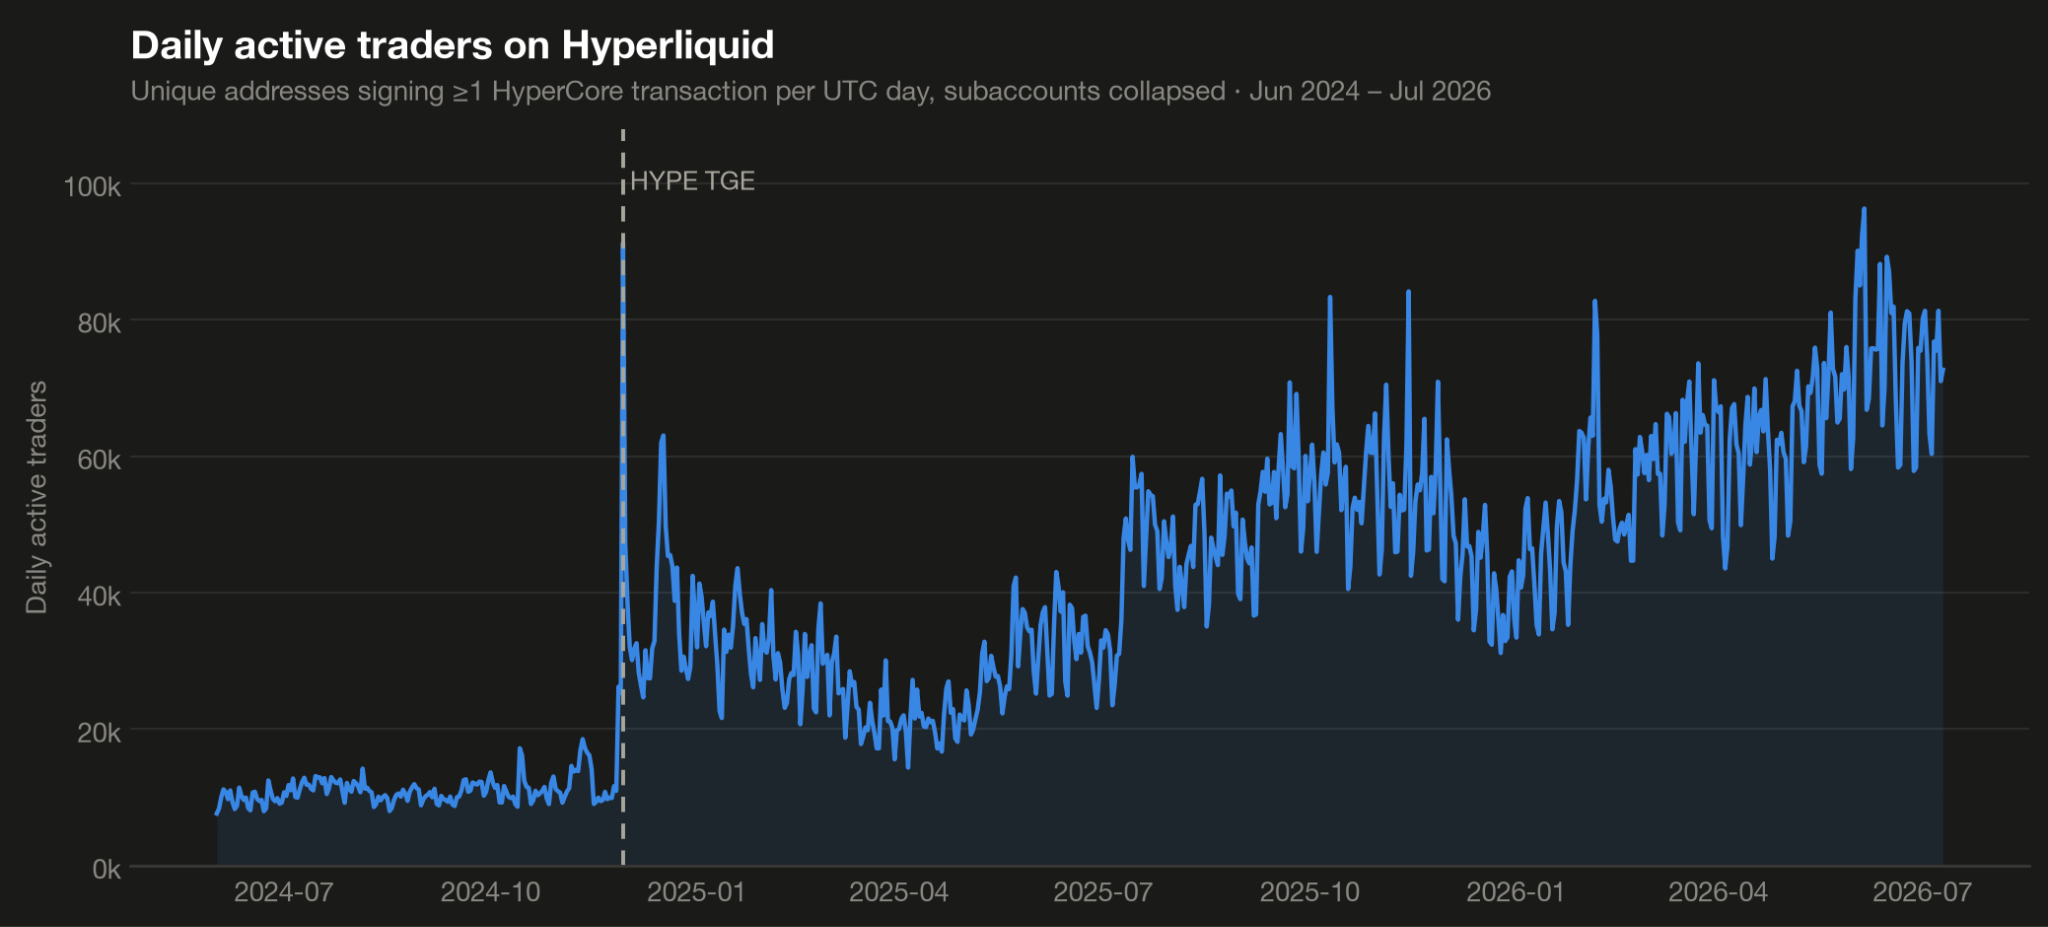
When the first post went out, Hyperliquid had about 10K DAUs. It now has about 80K, with monthly actives above 400k — and nearly all of that growth came after the points ended. The exchange does roughly $200B of perp volume a month, about 70% of all decentralized perp volume, and hit a record ~23% of Binance’s OI in May. In the first post I noted that Hyperliquid had the potential to challenge the dominant centralized exchanges — this has happened faster than I was expecting.
The airdrop test
The token launch created a natural experiment by splitting Hyperliquid’s users into two cohorts. Everyone who arrived before November 29, 2024 could farm points. Everyone who arrived after had no points to farm, no announced second airdrop, and only the hope that the HYPE supply reserved for future community rewards might someday fund one. Hope is an incentive too, so the experiment isn’t perfectly sterile. But given the uncertainty, Hyperliquid is not an especially attractive target for airdrop farmers.
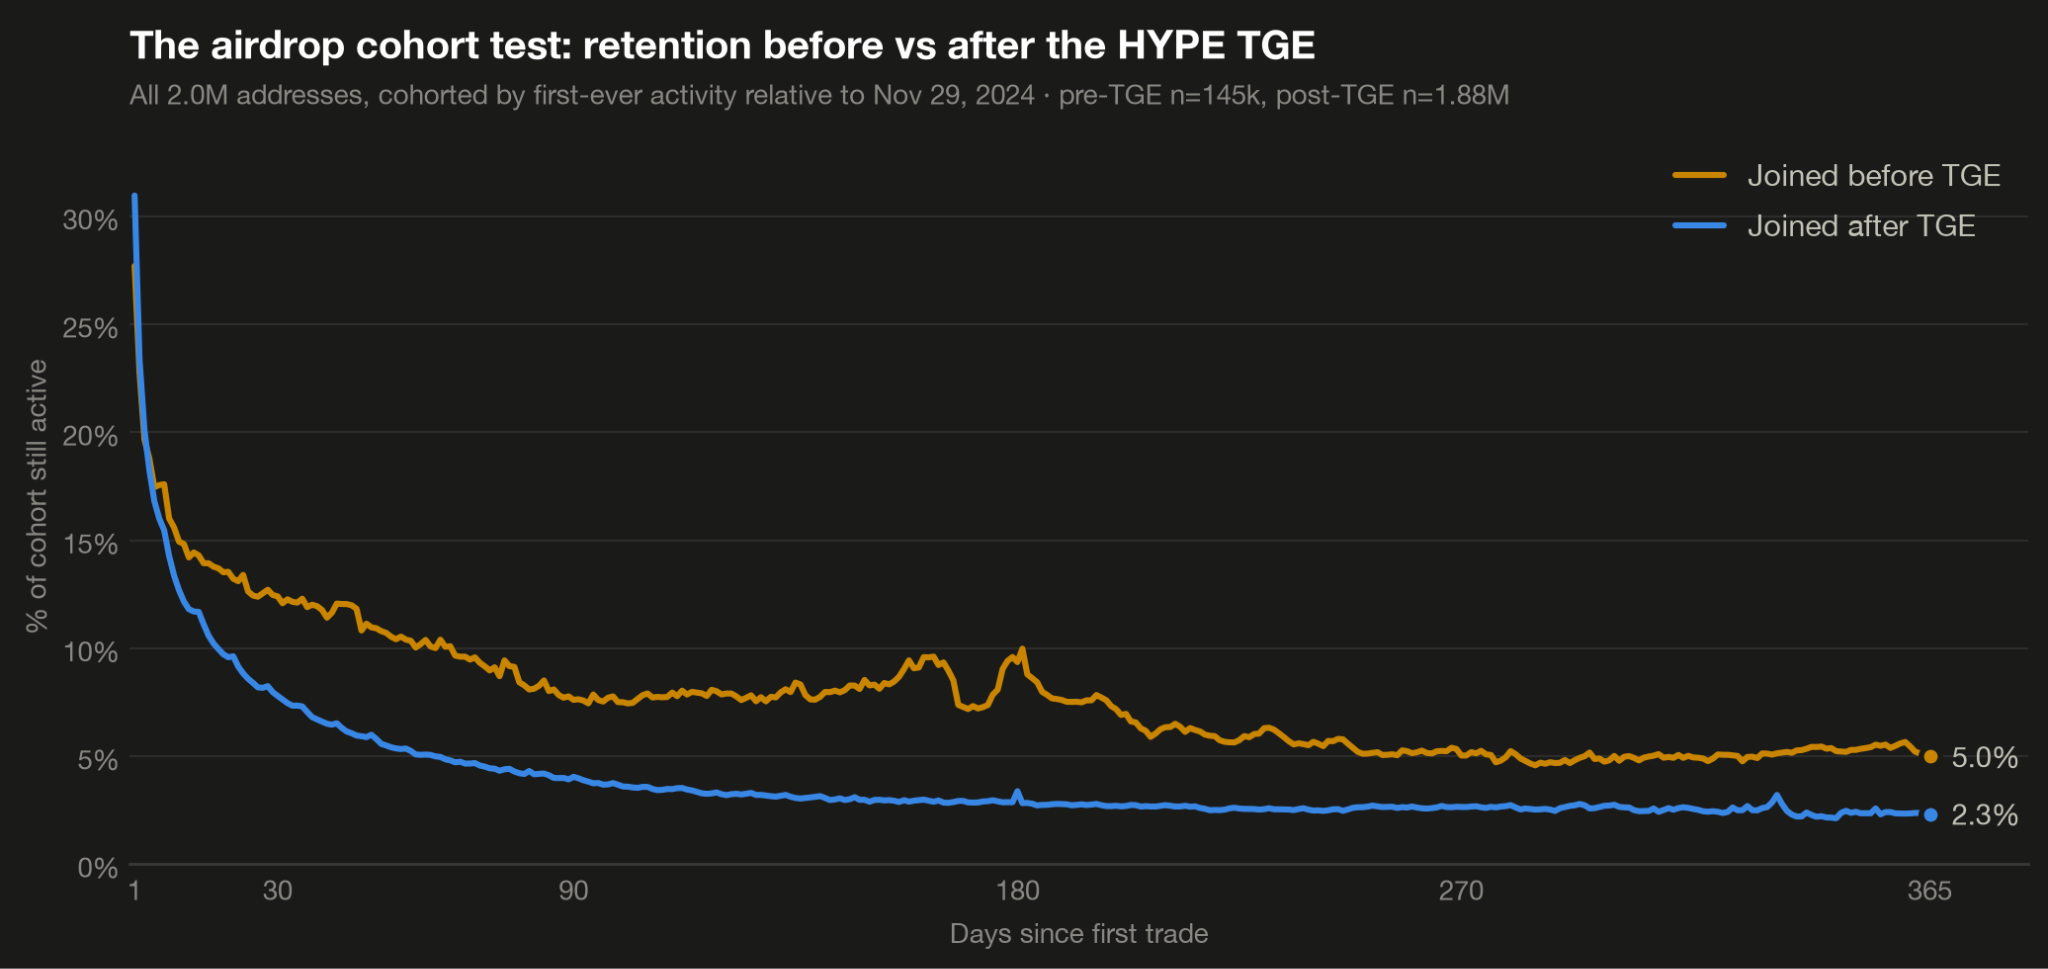
Across all addresses, the pre-TGE cohort retains about twice as well as the post-TGE cohort (5.0% vs 2.3% at one year). This is the reverse of the usual pattern: users acquired through incentives typically leave when the rewards end, while those who arrive afterward tend to be organic and retain better. Some of the gap likely reflects scale. 1.9M new addresses arrived after the TGE, and the marginal users churned quickly. Early users may also have been unusually high-intent; they found the product before it was famous.
The gap, however, matters less than the absolute level. Post-TGE whales — traders with $50m+ in lifetime volume or $1m+ in account equity who arrived after there was no longer anything explicit to farm — retain at ~47% after 30 days and ~22% after a full year, nearly indistinguishable from the incentive-era cohorts. New Hyperliquid whales are about as sticky as those who arrived before the airdrop.
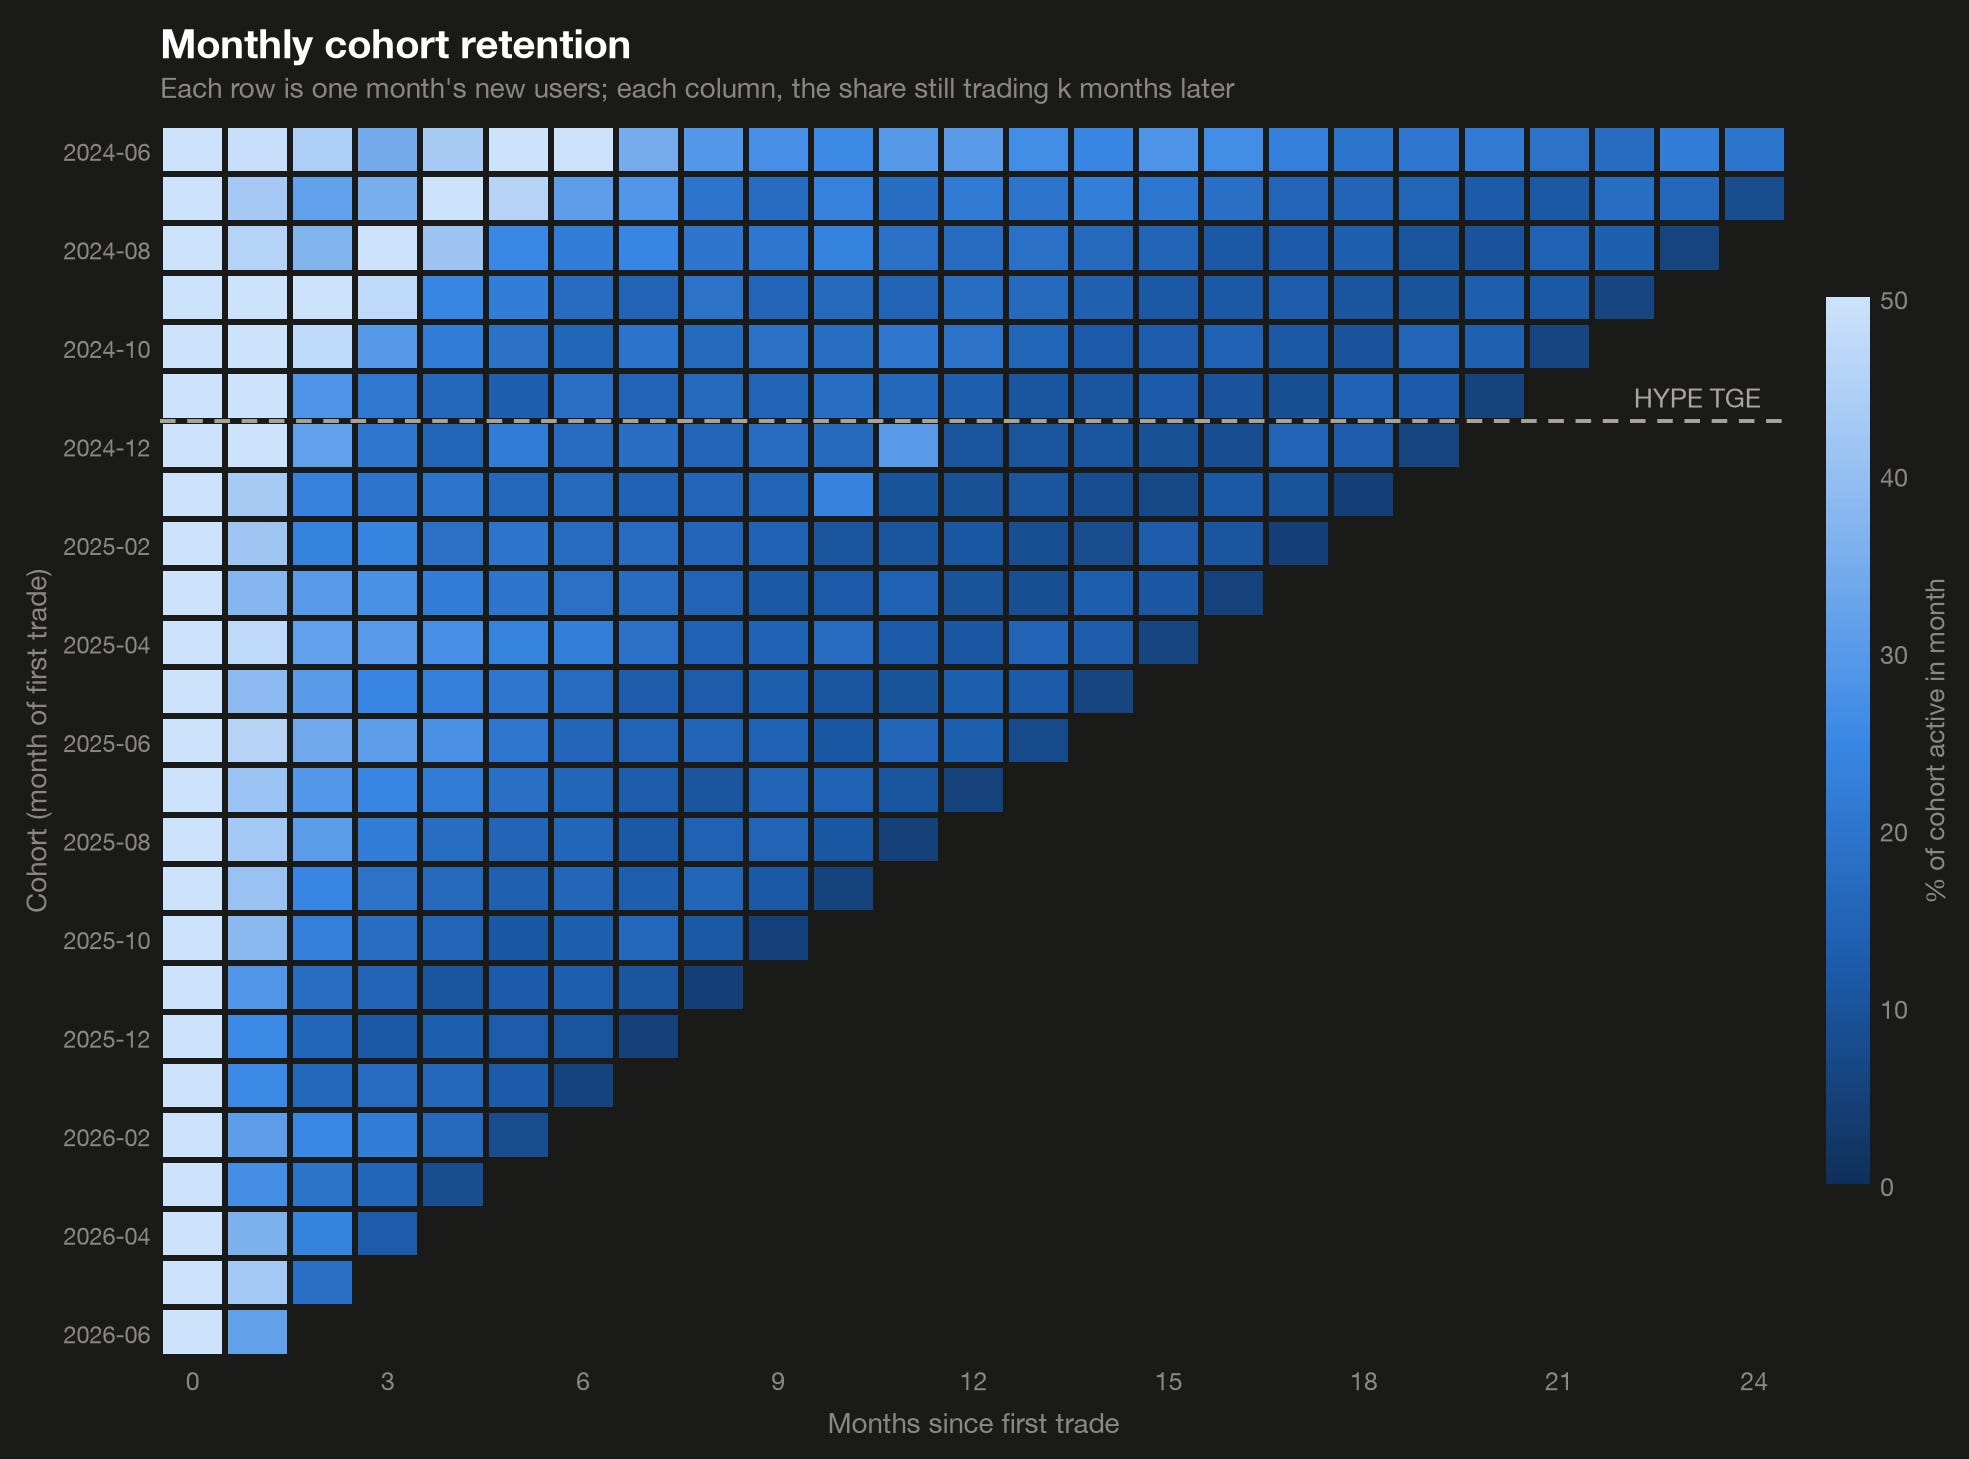
The cohort view shows the same thing with more resolution: every monthly cohort, before and after the TGE line, decays to a stable floor rather than to zero.
Over the past year, several well-funded competitors used the same playbook to build volume that at times rivaled Hyperliquid’s — Aster and Lighter each briefly flipped it on headline volume. Every one of them collapsed 60–95% once its incentives wound down: Lighter and Paradex within weeks of their token launches (Lighter had $250m withdrawn in the first 24 hours after its TGE), Aster and edgeX over the months after their emissions programs ended. dYdX, which is still paying trading rewards, has lost roughly 70% of its MAUs from their late-2024 peak anyway. Against that, Hyperliquid’s monthly volume has grown about 6x since its own incentives ended.
We would love to make this comparison in users rather than volume, but as far as we can tell, nobody outside those teams can: Lighter is a private zk-rollup, edgeX a validium, Paradex a private appchain, and Aster matches orders off-chain, so per-user activity never touches a public ledger. But few people know the guts of these systems well, and we’d be glad to be wrong — if you know a way to reconstruct per-user activity for any of them, reach out via DM and we’ll run the numbers. In the meantime, volume and OI are the two metrics every venue reports, and their verdict is unambiguous. Points buy activity; they evidently don’t buy retention.
How deep the retention goes
Across all 2.0m addresses, Hyperliquid’s retention curve looks remarkably similar to that of a top mobile app. D1/D7/D30 retention is 31/16/8, compared with 28/16/9 across AppMagic’s top 200 revenue-generating apps; at D360, the figures are 3% and 4%.
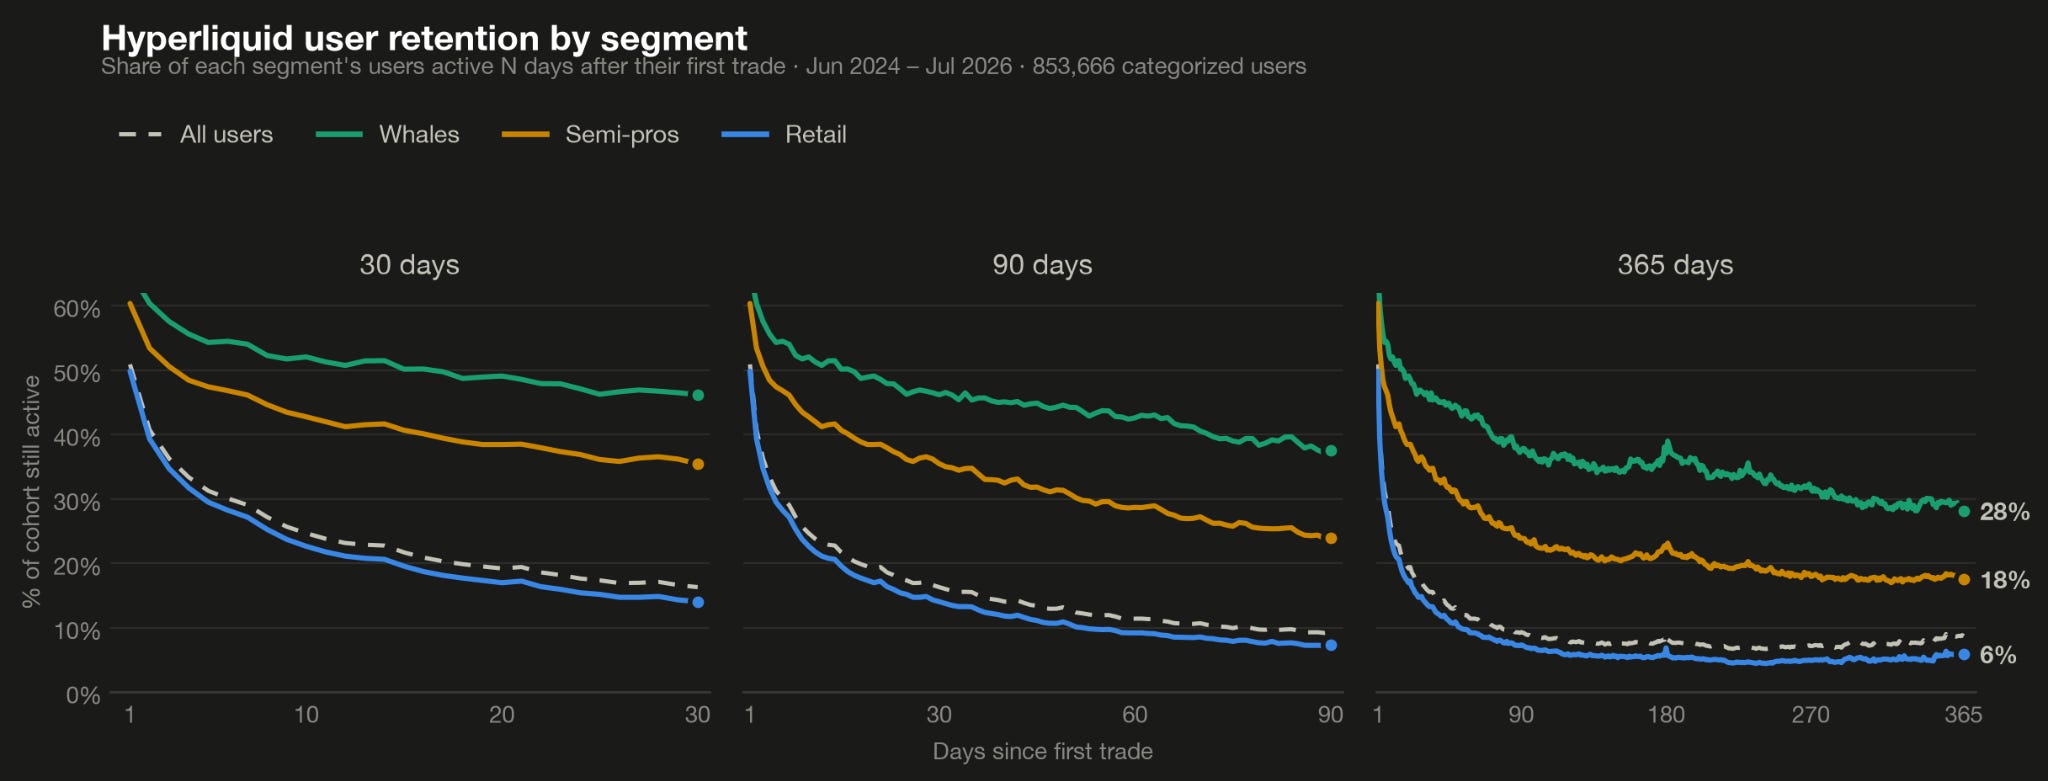
Against finance/investing apps, Hyperliquid is in a different league. Its 8% D30 retention is 4x Adjust’s global finance-app benchmark and 2x the European investment-app benchmark reported by AppsFlyer. The average also masks a much stickier core: after a full year, ~28% of whales, ~18% of semi-pros, and ~6% of retail traders remain active.
Methodological note: These are not identical measurements. App benchmarks begin at install, while ours begins at first observed onchain activity. The comparison is still informative because both measure the same underlying behavior: whether users return after first engaging with a product. See Appendix A for more info.
Engagement
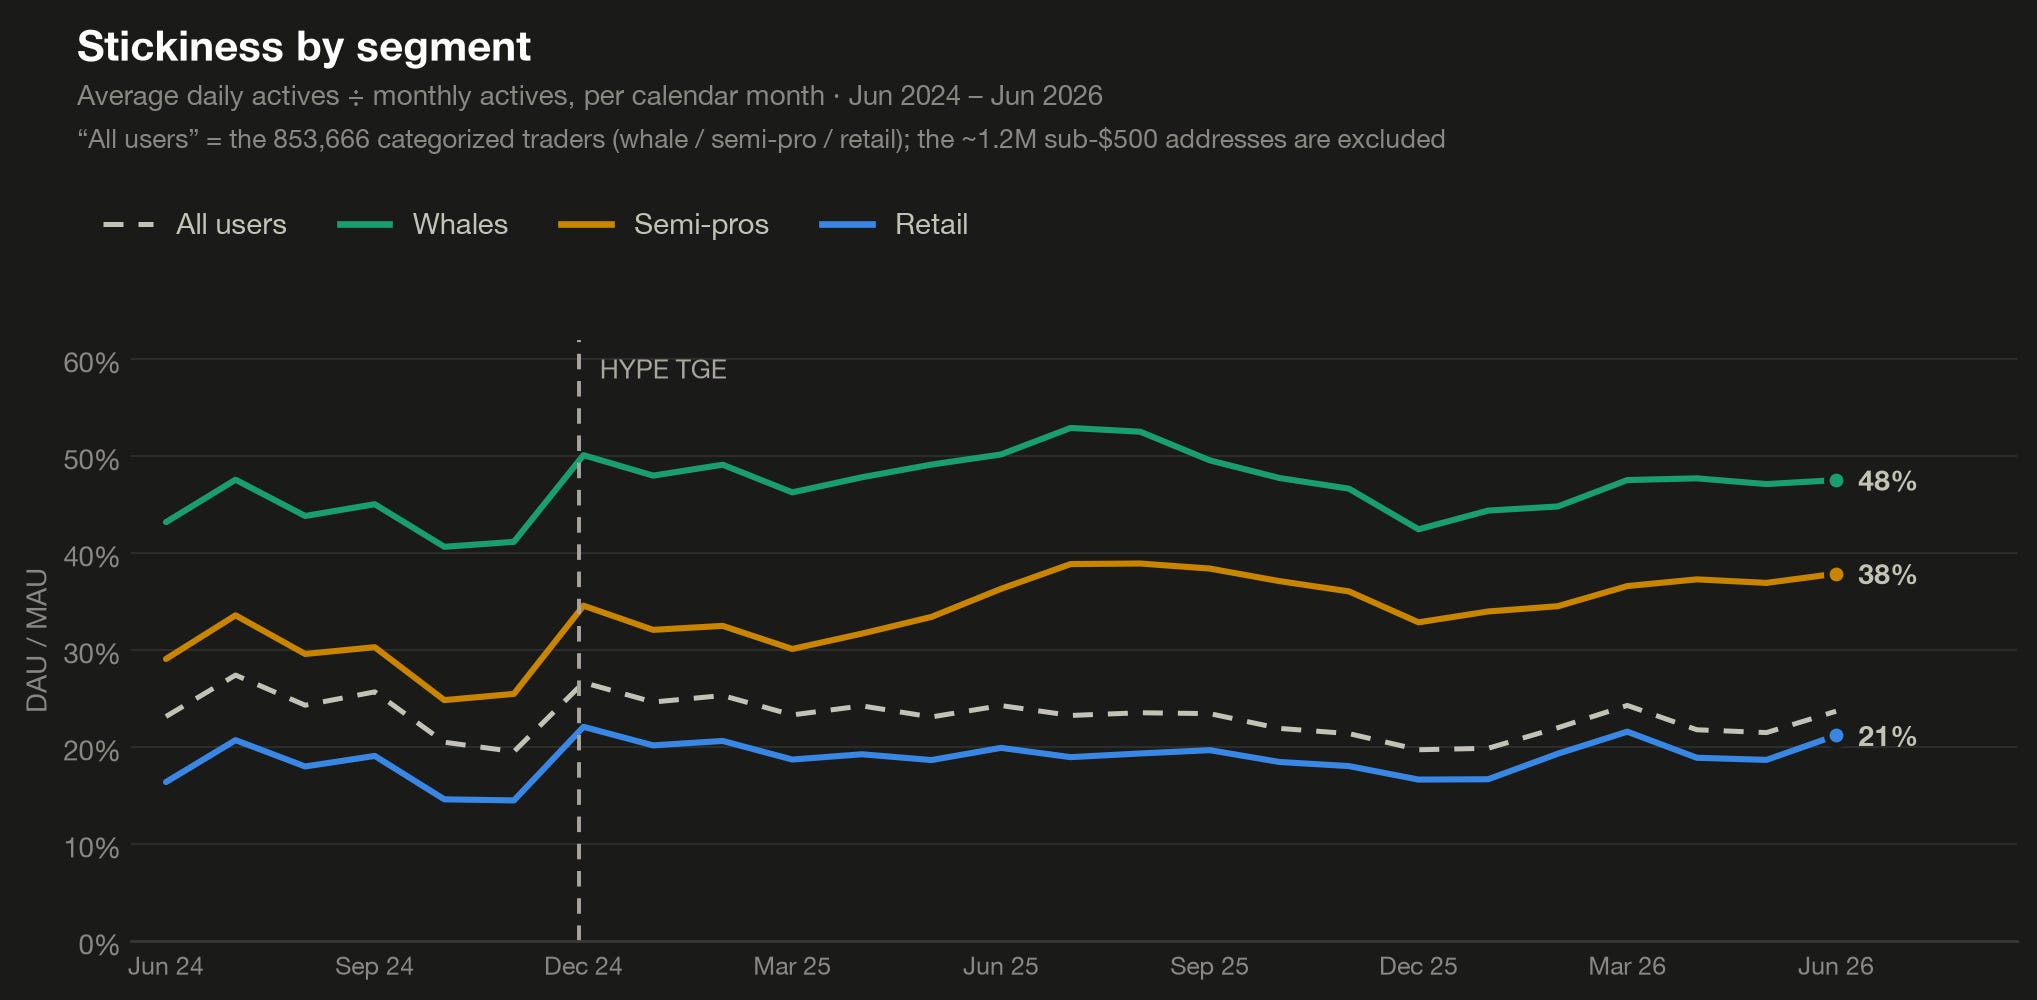
DAU/MAU measures frequency: a 48% ratio means that the average monthly whale is active on roughly 15 days a month. Whale stickiness was ~49% in late 2024 and is ~48% today, even as platform-wide daily actives grew 7x. Semi-pros improved from ~30% to ~38%, while retail held around 21%.
Those figures are exceptional even for a trading product. Sensor Tower described TradingView’s >30% DAU/MAU as record-high stickiness for a top investing app. Hyperliquid’s semi-pros are at 38%; its whales are at 48%. Rapid growth often dilutes engagement by bringing in users who are less committed than the existing base. That did not happen here.
Bitcoin beta
A fair objection to everything above is that this may all be crypto beta. Sensor Tower’s 2024 crypto-apps report found that the Bitcoin price alone explained 73% of the variation in crypto apps’ aggregate daily actives. If Hyperliquid followed the same pattern, its growth should reverse when Bitcoin does.
Bitcoin has reversed. BTC is down ~50% from its October 2025 peak. Hyperliquid’s daily actives are up ~30% over the same period.
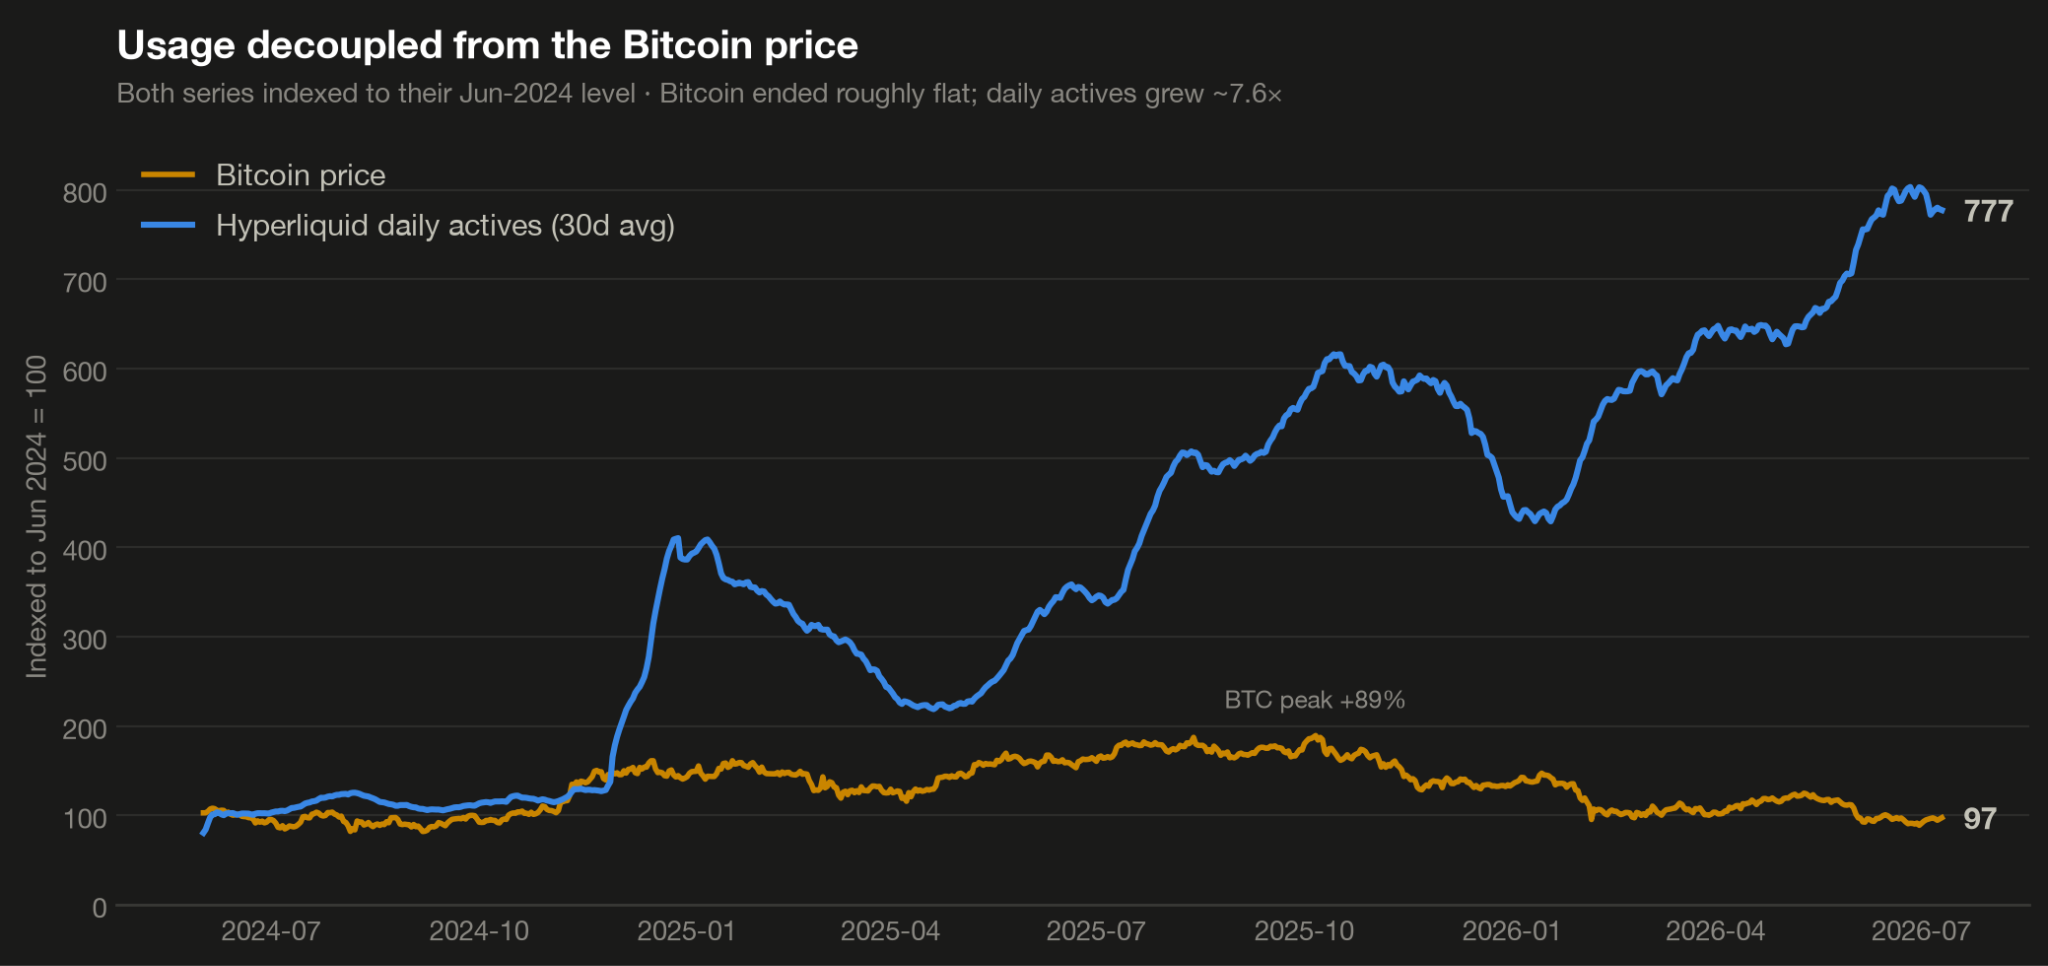
The full 770-day window tells the same story. Bitcoin fell 5%, while Hyperliquid’s daily actives grew ~8x. Bitcoin price explains only ~5% of the variation in Hyperliquid’s DAUs, compared with 73% across crypto apps, and neither week-to-week Bitcoin moves nor volatility has a statistically significant relationship with usage. Hyperliquid’s growth looks primarily like adoption, not crypto beta.
Where this leaves us
In 2024, these metrics gave us the confidence to double down on Hyperliquid. The central question we had then was whether users would remain once the incentives disappeared. Nearly 20 months later, retention has held and usage has multiplied.
We’d revisit our view if headline growth began masking deteriorating engagement among post-TGE cohorts, or if activity became concentrated among a shrinking group of large accounts. Neither has happened. We’re still building.
Appendix A: Methodology
This analysis uses publicly available Hyperliquid block data collected between 1 June 2024 and 10 July 2026 — every address signing at least one HyperCore transaction each UTC day. As before, each master account is treated as one user, with subaccounts explicitly mapped to their master accounts (~15k subaccounts across ~6.4k masters) so multi-account traders count once. Each user’s lifetime volume is reconstructed from raw on-chain fill data.
The methodology is more comprehensive than the previous post (which only used the public leaderboard) and therefore makes the categorized universe (~850k users) roughly 40x larger than the first post’s (~20k). Cohort percentages aren’t comparable across posts, though within-segment retention and engagement rates are computed identically. Segment thresholds are unchanged from 2024: whales (1.6% of categorized users) have $50m+ in lifetime volume or $1m+ in account equity; semi-pros (8.2%) have $2m–$50m in volume or $100k+ in equity; retail (90.2%) have $500–$2m in volume.
The reasons we gave in 2024 for trusting address-as-user still mostly hold (fee tiers are computed from master-account volume, so splitting activity across subaccounts is costly). To the extent users now fragment across unlinked accounts, our retention numbers are underestimates.
Comparability caveats: App-store retention benchmarks count installs — a much lower bar than a funded account placing a trade — so our numbers are flattered in one direction and penalized in the other: we don’t count users who opened the app without trading, which app metrics do. Windowed retention columns mix cohort vintages (day-365 retention is only observable for users who joined at least a year ago); the cohort heatmap disambiguates. Third-party dashboards (e.g. Artemis) report materially different DAU and MAU for Hyperliquid than we compute; the gap is definitional (address basis, EVM inclusion, rolling vs calendar windows), and we use our own series because we focus our trading on HyperCore and that is the focus of our research. Partial months are excluded from monthly aggregates. Bitcoin comparisons use daily closes over the same 770 days.
Appendix B: Follow-ups
The first post promised a session-duration proxy and a customer lifetime value analysis. We still owe both. LTV is fairly trivially computable — we have every user’s fill history, and fees are public — and deserves its own post. Session duration remains awkward to infer from transaction timestamps alone, but you may be able to infer interesting conclusions from when people open and close positions.
We’d also love to compute user retention figures for other perp DEXs, particularly Lighter.
If anyone would like to pick up and run with either of these efforts, send me a DM and I’d be happy to help.
Thanks to @rajivpoc for help with the original analysis and to @0xNessus and the Capital Sea team for review and feedback on this post.